Math
Convolution: kernels on a picture
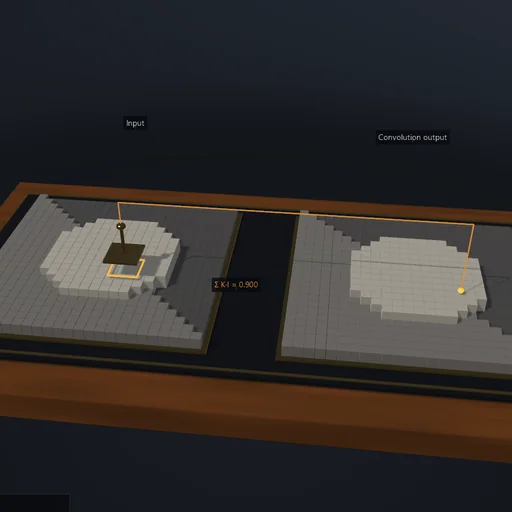
Edit 3×3 image-convolution kernels, inspect individual neighbourhood sums and compare blur, sharpening, edges and embossing.
Try this
Edit all nine kernel coefficients or load a preset. The marked source neighbourhood produces the marked output pixel by true convolution (the kernel is reversed in both axes). Values remain unclipped in readouts; display uses grayscale or a signed colour scale.
Equations used in the module
Equations
(K*I)(x,y) = ΣuΣv K(u,v) I(x−u,y−v)
Mean and Gaussian blur have ΣK=1; Laplacian edge kernel has ΣK=0
Zero, clamped and periodic boundaries give different edge behaviour
The output is not clipped before measurement