Math
Simpson's paradox
Construct Simpson’s paradox with editable group weights and success rates, and compare subgroup and aggregate results.
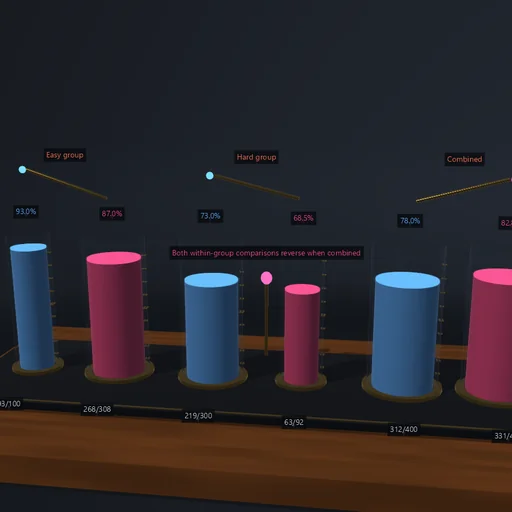
Try this
Method A is blue; method B is pink. Each has 400 observations divided between easy and hard groups. Adjust group sizes and success rates: weighting can reverse the aggregate comparison even when A leads in both groups. This is a synthetic example, not causal evidence.
Equations used in the module
Equations
Overall rate = (n₁p₁+n₂p₂)/(n₁+n₂)
A and B may have different group weights
A₁>B₁ and A₂>B₂ can coexist with Aoverall<Boverall
The aggregate comparison alone cannot establish a causal effect