Astronomy
Hertzsprung–Russell diagram
Explore temperature, luminosity and radius, compare two 3D stars, and inspect an offline HYG colour–magnitude sample.
What happens
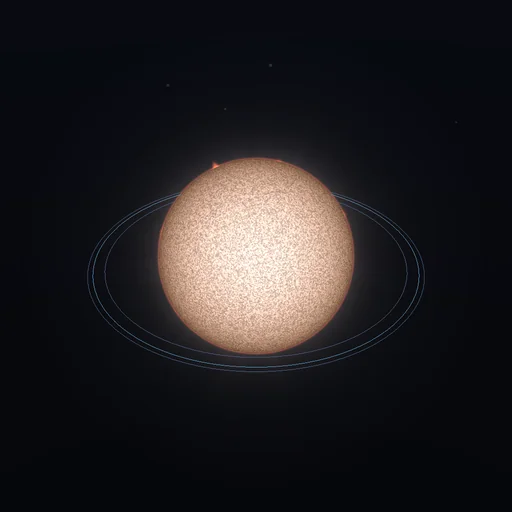
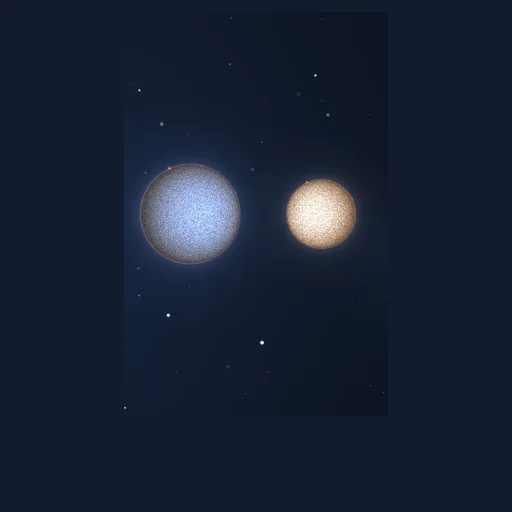
Drag the point on the physical diagram. Temperature decreases to the right and bolometric luminosity increases upward; both axes are logarithmic. The radius follows the Stefan–Boltzmann relation. Compare two stars at the same temperature: a hundredfold luminosity needs a tenfold radius. The main-sequence guide and physical presets are illustrative, not measured objects or age tracks. Arbitrary parameters need not describe an equilibrium star. In the separate observed view, B−V and M_V come from a selected HYG sample. Distances and visual magnitudes determine M_V with zero extinction correction. No bolometric radius is inferred from these data. Photospheric colour and granulation are display illustrations.
Equations used in the module
Equations
L = 4*pi*R²*sigma*T_eff^4; T_sun = 5772 K (IAU 2015 B3)
R/R_sun = sqrt(L/L_sun) * (5772 K / T_eff)²
physical axes: log10(T_eff/K), reversed; log10(L/L_sun), upward
observed axes: B-V (mag), rightward; M_V (mag), brighter upward
M_V = V - 5*log10(d/pc) + 5; A_V = 0 here (not extinction-corrected)
display colour only: T_colour = 4600 K * (1/(0.92*(B-V)+1.7) + 1/(0.92*(B-V)+0.62))
physical radii: R_display proportional to R, or explicitly compressed as R^0.22
HYG v4.0 teaching sample; d <= 100 pc; no parallax-uncertainty cut; not a volume-complete population
observed M_V is not M_bol; observed points have no inferred bolometric radius or age