Astronomy
Spectral lines and classification
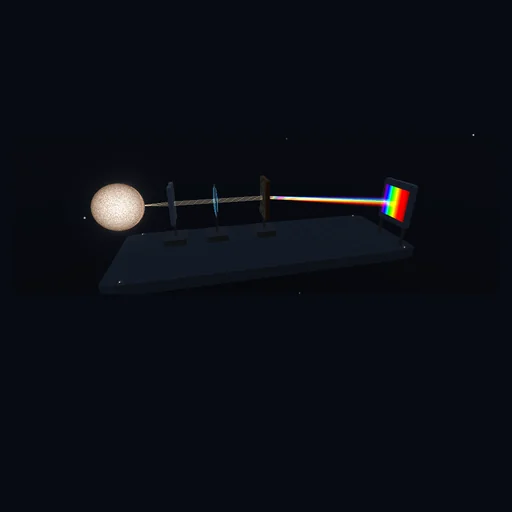
Split starlight in a 3D spectrograph, resolve the sodium doublet, measure absorption and match a recorded noisy spectrum.
What happens
Split starlight in a 3D spectrograph, resolve the sodium doublet, measure absorption and match a recorded noisy spectrum.
Teaching model: 14 rounded atomic references and 2 broad TiO envelopes; empirical temperature strengths, not LTE/NLTE or a quantitative abundance scale. Air references are converted to vacuum with standard dry-air Ciddor dispersion. Intrinsic Gaussian width combines thermal motion and the chosen velocity dispersion; no rotational or Stark profile. A normalized Gaussian instrument response convolves flux on a log-wavelength grid; R is controlled independently of the illustrative optical layout. Stellar size, granulation, limb darkening, beam brightness and visible colours are illustrative. Observations use 3 pixels per resolution element and independent Gaussian noise with constant continuum S/N per pixel. Changing target, S/N or the template never rewrites an existing observation; record again explicitly. Classification labels indicate template temperature only.
The model and its limits
Teaching model: 14 rounded atomic references and 2 broad TiO envelopes; empirical temperature strengths, not LTE/NLTE or a quantitative abundance scale. Air references are converted to vacuum with standard dry-air Ciddor dispersion. Intrinsic Gaussian width combines thermal motion and the chosen velocity dispersion; no rotational or Stark profile. A normalized Gaussian instrument response convolves flux on a log-wavelength grid; R is controlled independently of the illustrative optical layout. Stellar size, granulation, limb darkening, beam brightness and visible colours are illustrative. Observations use 3 pixels per resolution element and independent Gaussian noise with constant continuum S/N per pixel. Changing target, S/N or the template never rewrites an existing observation; record again explicitly. Classification labels indicate template temperature only.
Equations used in the module
Equations
D = sqrt((1 + v/c)/(1 - v/c)); lambda_observed = D lambda_rest, positive v = receding; vacuum wavelengths
sigma_intrinsic/c = sqrt(kT/m + sigma_velocity^2)/c; TiO uses broad phenomenological envelopes
u = ln(lambda); sigma_instrument = 1/(2 sqrt(2 ln 2) R); normalized Gaussian convolution of lambda F_lambda and lambda continuum
EW = integral_window (1 - F/F_continuum) d lambda; centroid = integral lambda (1 - F/F_continuum) d lambda / EW
Blended windows have total EW and no single-line FWHM. Finite window clipping and continuum slope affect EW.
Grating: sin(theta) = m lambda / d, m=1, normal incidence; schematic hardware, not an optical design solver
Observation: 3 pixels per resolution element; pixel averages + independent N(0, 1/SNR^2); chi^2/N over the entire recorded band
Rough OBAFGKM temperature templates only, not an atmosphere solver or a unique inverse solution.