Math
Monte Carlo
Random darts estimate π, two hundred throwers show the spread predicted by 1/√N and the 95 % band, and one integral is taken three ways - the sampler that leans like the curve wins twentyfold.
What happens
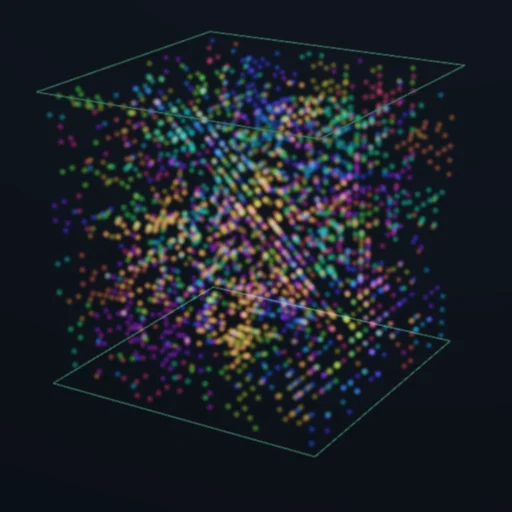
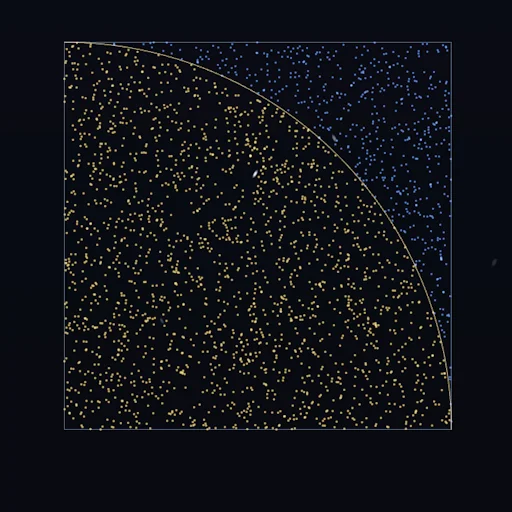
Darts land at random in a square with a quarter circle drawn in it: gold when they fall inside the circle, blue when they miss. The fraction inside is π/4, so four times the fraction is an estimate of π, and it is read off live. In the cube the shape is a sphere and the factor is six; the cube is the worse thrower, because π/6 is far from one half and the factor is bigger. The estimate is a binomial mean, so its error is exactly s/√N with s = 4√(p(1 − p)) = 1.642 in the square: four times the darts halve the error, a hundred times the darts buy one more digit. Two hundred other throwers with different dice throw the same number of darts invisibly; their estimates pile into the histogram under the predicted bell, and the panel counts how many sit inside π ± 2s/√N - about 190 of 200, the 95 % band, measured rather than asserted. The chart draws the live estimate against log N between the two band lines, which close in as 1/√N. The third scene takes one integral, the area under 4/(1 + x²) from 0 to 1, which is also π, three ways from the same die. Hit-or-miss throws darts under the curve, s = 1.642. The mean value evaluates the curve at uniform x and averages, s = √(4 + 2π − π²) = 0.643. Importance sampling draws x from the density q(x) = (4 − 2x)/3 (dashed), which leans like the curve, and averages the ratio curve/q: s = 0.080. Three histograms of two hundred replicas each show the three widths - same N, twenty times less error for the sampler that knows where the curve is heavy.
Equations used in the module
Equations
darts:  P(inside quarter circle) = π/4;  π_est = 4 n_in/N;  Var(π_est) = 16 p(1 − p)/N,  s = 4√(p(1 − p)) = 1.642;  in the cube p = π/6, π_est = 6 n_in/N, s = 6√(p(1 − p)) = 2.997;  standard error s/√N: 0.0164 for N = 10 000 in the square
law:  200 replicas with different dice, seeds 100 … 299: spread 0.0707 / 0.0358 / 0.0191 at N = 500 / 2000 / 8000 in the square against predicted 0.0734 / 0.0367 / 0.0184;  191 / 195 / 192 of 200 inside π ± 2s/√N;  sixteen times the darts, the spread falls by 3.7 ≈ 4
integral:  I = ∫₀¹ 4/(1 + x²) dx = π;  hit-or-miss: darts in [0, 1] × [0, 4], 4·hits/N, s = 1.642;  mean value: (1/N) Σ g(x_i), x_i uniform, s = √(E g² − π²) = √(4 + 2π − π²) = 0.643;  importance: x_i ~ q(x) = (4 − 2x)/3, (1/N) Σ g(x_i)/q(x_i), s = √(∫ g²/q − π²) = 0.0800;  sampling q by inversion: x = 2 − √(4 − 3u)
seed 1, N = 10 000: 7865 darts inside the quarter circle (π ≈ 3.1460), 5203 inside the sphere (3.1218);  the integral: 3.1760 / 3.1395 / 3.1408;  100 replicas of N = 1000 (seeds 300 …): spreads 0.0536 / 0.0204 / 0.0024
die:  the shared xorshift; per sample the streams are (u, v) for hit-or-miss, x for the mean value, w for importance, in that order