Math
Why the bell appears
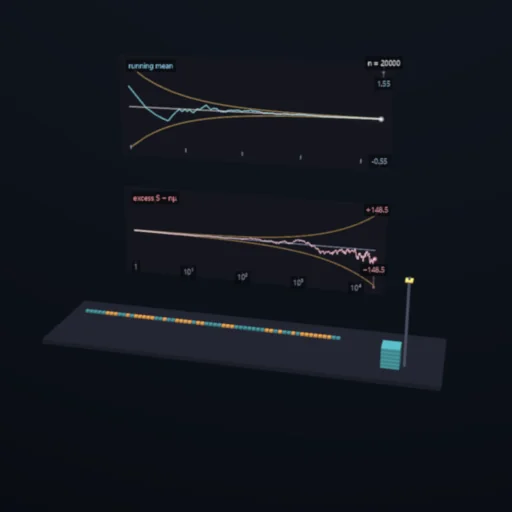
Add up draws from any shape - a die, a loaded coin, two humps, the long tail of a waiting time - and the standardised sum turns into the same bell. One sample is collected before your eyes and becomes one point of the series beside it; the sum, the mean and the standardised sum are three names of that point. Cumulants of a sum add, so the skewness falls as 1/√n and the excess kurtosis as 1/n, and the sheet measures both. And one source breaks it: a Cauchy has no variance, and no bell ever appears.
What happens
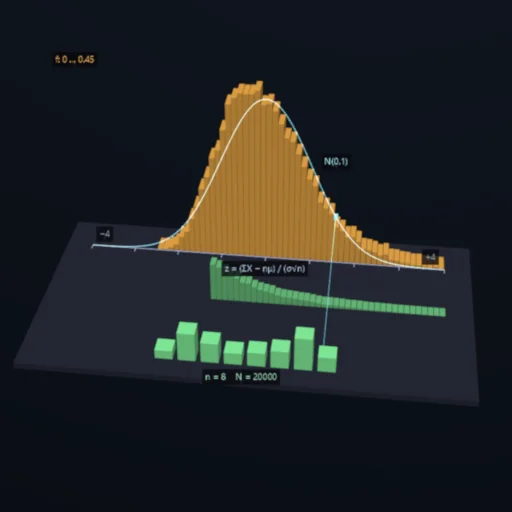
Add up many small independent pieces and the sum falls on the same bell curve whatever the pieces were - that is the central limit theorem, and this module shows it happening and measures how fast. Skewness of the sum dies as 1/√n, excess kurtosis as 1/n: a coin's sum is bell-shaped by a dozen throws, an exponential's lopsided tail needs many more. The exact distribution of the sum is built by convolution and compared with a sampled one and with the normal. Pick a source, raise n, and watch the histogram straighten while the Kolmogorov distance falls.
Equations used in the module
Equations
Z = (X₁ + … + X_n − nμ) / (σ√n)
κ_k(Z) = κ_k(X) / (σ^k n^{k/2−1}):  skewness ∝ 1/√n, excess kurtosis ∝ 1/n
uniform: γ₂ = −6/5;  exponential: γ₁ = 2, γ₂ = 6
Kolmogorov distance to the normal, exact pmf by convolution