Earth
Climate scenarios laboratory
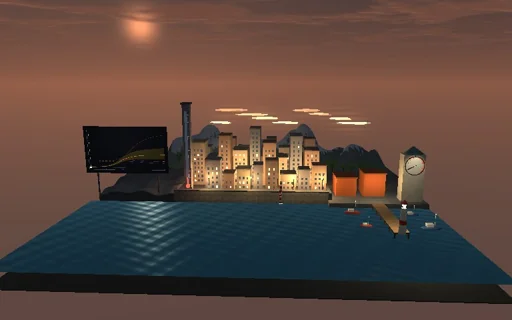
Watch a coastal city at dusk across its bay from 1850 to 2300 while the climate answers the carbon dioxide we add: the surface and the upper ocean warm within years, the deep ocean takes centuries, and the sea rises against the harbour wall as the water expands and the ice melts. Follow the low, medium, high or overshoot pathway, or hold the concentration from today and see the warming go on - the deep ocean is still catching up. Double CO2 at a stroke and the warming follows two exponentials, a fast one of four years and a slow one of over two centuries; raise it by 1 % a year and read the transient response at doubling; set off a volcano and watch a few tenths of a degree of cooling fade. Change the sensitivity and the ocean and the board redraws every pathway; the energy taken in is booked against the heat stored and radiated away to round-off.
What happens
Two layers share the heat: the surface with the upper ocean, heat capacity C = 8 W·yr/m² per K, and the deep ocean, C_d = 100: C·dT/dt = F − λT − γ(T − T_d), C_d·dT_d/dt = γ(T − T_d), with the exchange γ = 0.7 W/m² per K and the feedback λ = F_2x/ECS = 1.24 W/m² per K for an equilibrium sensitivity of 3 K (F_2x = 5.35·ln 2 = 3.71 W/m²). The forcing is 5.35·ln(CO2/280) W/m², scaled by the share of the other forcings, plus each eruption’s −3 W/m² fading over a year. The pathways follow historical CO2 to 425 ppm in 2025, then rise to 420, 600, 1050 or 470 ppm in 2100 (low, medium, high, overshoot) or hold. The system is linear: an abrupt doubling warms by (F/λ)(1 − a_f·e^(−t/τ_f) − a_s·e^(−t/τ_s)) with τ_f = 4.1 years, τ_s = 226 years, a_f = 0.62 and a_s = 0.38 - 2.10 K after 50 years, 95 % of ECS after 450; a 1 %/yr rise reaches TCR = 1.92 K at doubling, by the closed-form ramp response. Sea level is thermal expansion, 1.9 mm per W·yr/m² of heat taken up, plus ice approaching 1.2 m per K over 500 years. RK4 steps of a tenth of a year, split at every keypoint, eruption and change of the forcing; the forcing and λT are summed with the same weights, so the energy ledger ∫F dt = C·T + C_d·T_d + ∫λT dt closes to round-off, and the crossings of 1.5 and 2 K are located inside the step by bisection. Medium: 2.43 K and 0.67 m in 2100; high: 3.96 K and 0.86 m in 2100, 7.4 K and 4.0 m in 2300.
Try this
Run the medium pathway and watch it cross 1.5 K in 2038 and 2 K in 2065 while the sea creeps up the wall. Switch to the high pathway and the harbour floods before 2200 and the wall is overtopped by 2300; the overshoot falls back below 1.5 K only in 2223. Press Hold to freeze the concentration and watch the warming go on, or set off a volcano. The abrupt doubling and the 1 %/yr rise are drawn beside their closed forms on the board.
The model and its limits
A global mean two-layer energy balance: no geography, no seasons, no weather or internal variability, a constant feedback with no efficacy of the deep-ocean warming, CO2 concentrations prescribed with no carbon cycle, the other forcings a fixed share of the CO2 forcing, volcanoes a single e-folding pulse, sea level from a constant expansion coefficient and a single-time-scale ice term with no ice-sheet instability. The pathways resemble, but are not, the IPCC scenarios; the numbers belong to this teaching model, not a forecast of a particular year.
Equations used in the module
Equations
C·dT/dt = F − λ·T − γ·(T − T_d),  C_d·dT_d/dt = γ·(T − T_d)
F = (1 + s)·5.35·ln(CO2/280) − ∑ A·e^(−(t − t_e)/τ_v),  ECS = F_2x/λ
T(t) = (F/λ)·(1 − a_f·e^(−t/τ_f) − a_s·e^(−t/τ_s)),  TCR = T at the doubling of a 1 %/yr rise
ΔSL = η·(C·T + C_d·T_d) + S_i,  dS_i/dt = (b·T − S_i)/τ_i,  ∫F dt = C·T + C_d·T_d + ∫λ·T dt