Math
Logistic map and bifurcation
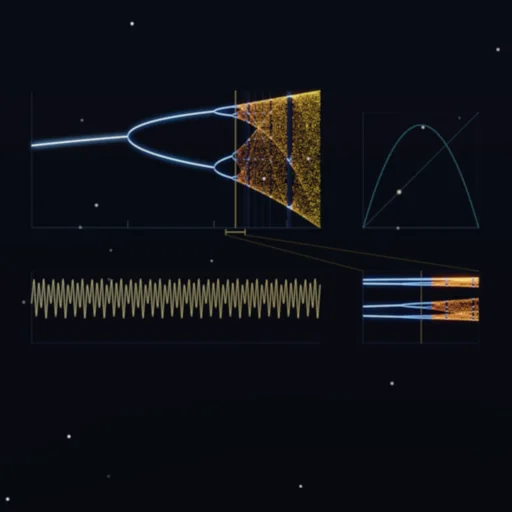
The period-doubling cascade as a glowing curtain coloured by the Lyapunov exponent, with a live cobweb orbit at the marker - doublings at 3 and 1 + √6 exactly, chaos at the end.
What happens
One number per step: x → r·x·(1 − x). The curtain is the bifurcation diagram - one column of settled orbit points per r - and its colour is the MEASURED Lyapunov exponent: cool blue where an orbit attracts, hot where neighbouring starts fly apart, and the periodic windows cut cold slots straight through the fire. The golden marker walks the curtain, and the cobweb beside it plays the same r live: the parabola, the diagonal, and the orbit bouncing between them - settling on a point, a 2-cycle, a 4-cycle, or never. The closed forms are printed next to the measurements: the fixed point's multiplier is 2 − r, so the first doubling sits at r = 3 exactly; the 2-cycle's is −r² + 2r + 4, so the second sits at 1 + √6; the ratios of the doubling steps close on Feigenbaum's δ = 4.669, the same constant for a vast class of maps. The period-3 window opens by tangency at 1 + √8 exactly, and at r = 4 the map IS angle doubling in disguise - its Lyapunov exponent is ln 2.
Equations used in the module
Equations
x → r·x·(1 − x) on [0, 1]
fixed point:  x* = 1 − 1/r,  multiplier 2 − r:  stable for 1 < r < 3, first doubling at r = 3 EXACTLY
2-cycle:  multiplier −r² + 2r + 4:  second doubling at r = 1 + √6
superstable:  f^(2^k)(1/2) = 1/2 at R1 = 2, R2 = 1 + √5, R3, R4, ... and (R_k − R_(k−1))/(R_(k+1) − R_k) → δ = 4.669  (Feigenbaum)
period-3 window opens by tangency at r = 1 + √8
r = 4:  f(sin²t) = sin²(2t) - angle doubling;  Lyapunov exponent λ = ln 2