Physics
Radioactivity
Decay as statistics: half-life from thousands of glowing nuclei, decay chains on the nuclide chart, a chain reaction going critical, and dating by isotopes.
What happens
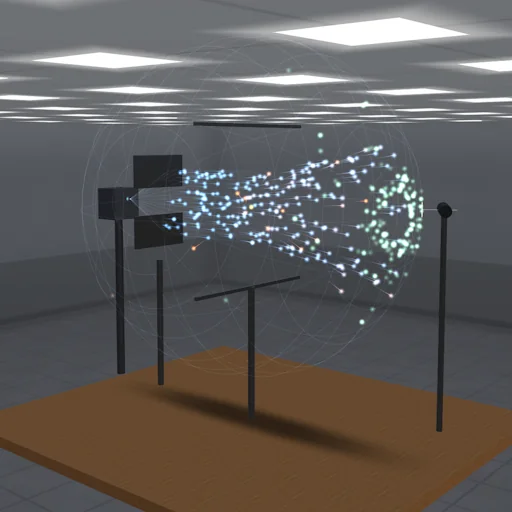
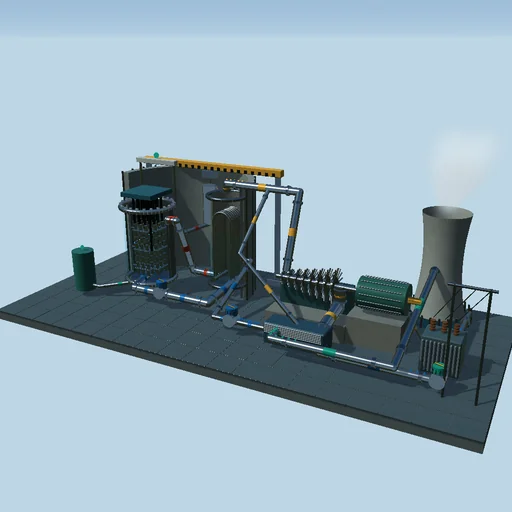
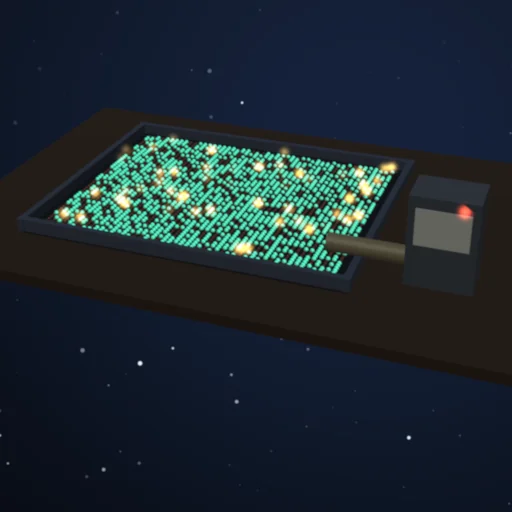
A wall of 2500 nuclei dies one flash at a time and the survivor count hugs N₀·2^(−t/T½) - behind it, the Gamow barrier turns a doubled alpha energy into twenty decades of half-life, the straight Geiger-Nuttall line. The U-238 chain crawls the nuclide map with α and β moves down to stable Pb-206 while a fast daughter locks into secular equilibrium with its slow parent. In the uranium sphere, Monte Carlo neutrons scatter, capture and fission: slide the enrichment and radius and watch k_eff cross one - and learn that a bare natural-uranium ball never gets there. Finish in the museum: read a sample’s carbon fraction and let −T½·log₂(N/N₀) date it.
Equations used in the module
Equations
N(t) = N₀ 2^(−t/T½),   λ = ln 2 / T½
A = λ N   (activity)
chain: dN₂/dt = λ₁ N₁ − λ₂ N₂;   k_eff > 1 → chain reaction
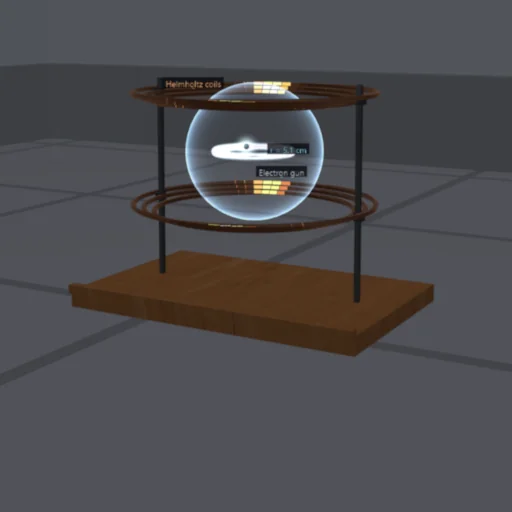
the reflector:  a neutron crossing the surface returns with probability 0.5 (albedo);  R_crit by bisection on k_eff(R) = 1, Monte Carlo 6 000 neutrons: for 94 % bare between 8 and 12 cm, less with the reflector;  natural uranium, bare: none under 50 cm