Math
Fourier series
Epicycles assembling a drawing, sines assembling a wave, and the overshoot at a jump that never goes away.
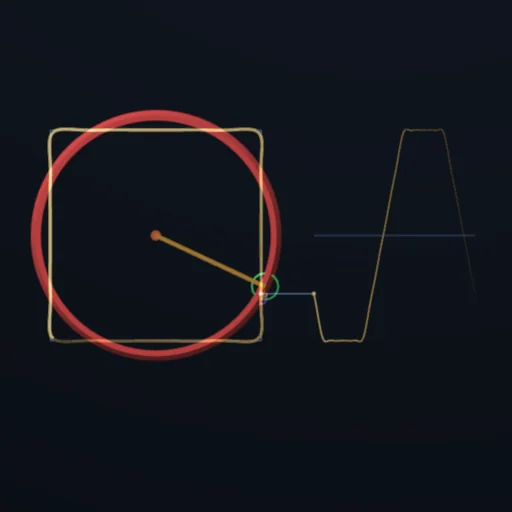
What happens
Any drawing that closes on itself can be written as a sum of circles: the Fourier coefficients of the curve, each a circle of radius |c_k| turning k times a lap, stacked centre on rim, with a pen at the end of the last arm. The largest circles come first, and every extra circle brings the pen closer to the drawing - the rms error is measured on the panel, not promised; a square needs only odd harmonics with alternating sign. The trace is left behind in time as well, a corkscrew receding into the depth. The waveform view fans the harmonics of a square wave out in depth, one sine per plane, with their sum in front: the sum climbs toward the square and overshoots at the jump, and the overshoot is 8.95 % of the jump for every N past a dozen - narrower, never smaller. That is Gibbs, and it is measured here. Parseval closes the loop: the sum of |c_k|² is the mean square of the signal.
Equations used in the module
Equations
f(x) = a₀/2 + Σ (a_n cos nx + b_n sin nx),   b_n = (1/π) ∫ f(x) sin nx dx
square wave:  f = (4/π) Σ sin(nx)/n over odd n;   sawtooth 2/(πn), triangle 8/(π²n²)
Gibbs:  max S_N → 1 + 2·0.08949 for every large N - the overshoot narrows, never shrinks
Parseval:  Σ |c_k|² = mean square of f
epicycles:  c_k = (1/M) Σ z_m e^(−2πikm/M),   z(t) = Σ c_k e^(2πikt): circles of radius |c_k| turning k times a lap